
Infographics are an excellent way of data presentation in an engaging and interesting format. They can be used for any topic, from the history of the world to your daily breakfast routine.
This article about infographics will explore its benefits & drawbacks as a communication tool and also some helpful tips to create better infographics. Let’s start with the basics!
What Is an Infographic?
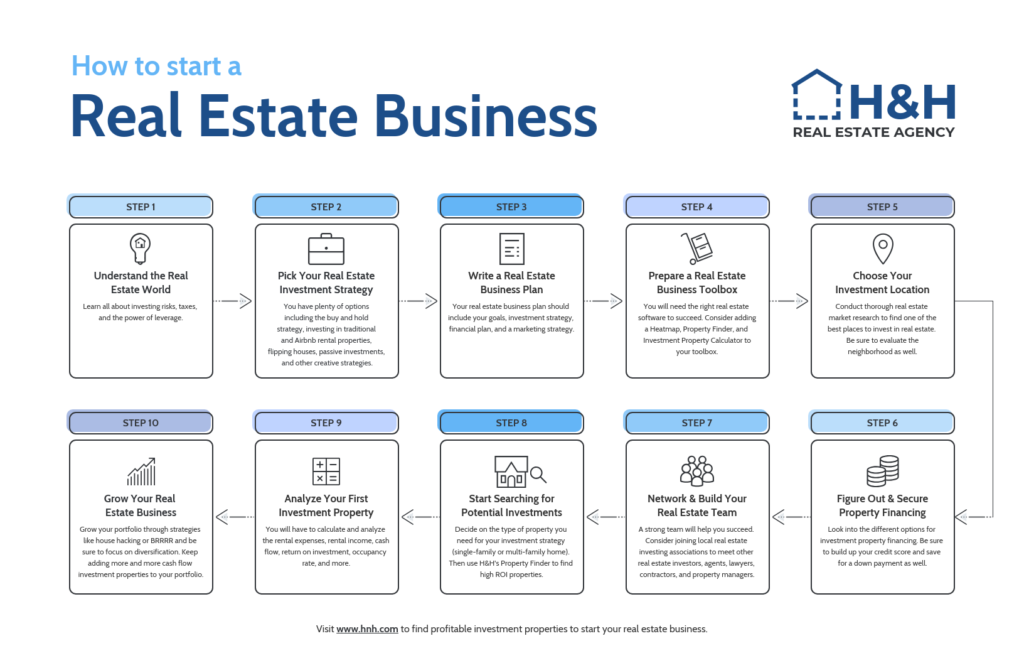
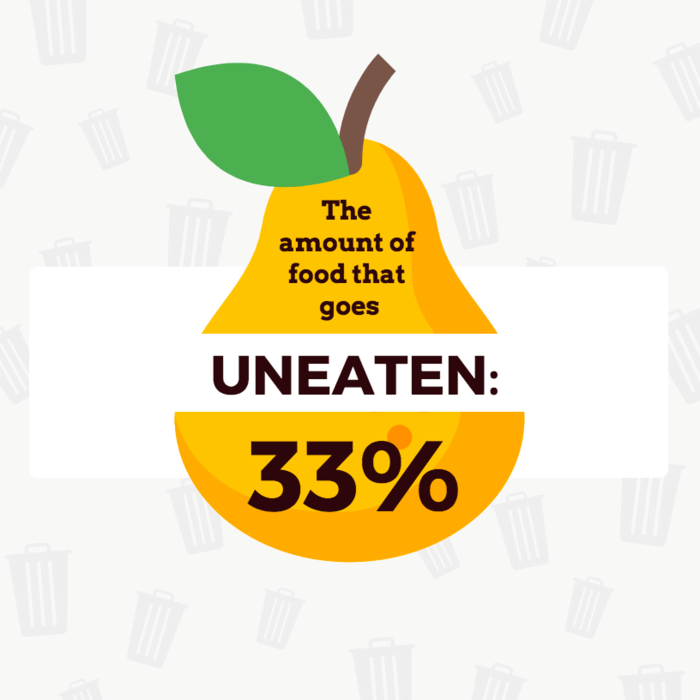
An infographic is a visual data representation in the form of a chart or illustration. Some infographics might be simple bar charts and line graphs, while others may include detailed illustrations or photographs with short captions.
Infographics can convey complex ideas quickly and efficiently to an audience because they require less reading than the equivalent amount of text would. This is specifically true for visual learners who tend to retain information better when it is presented in a visual format.
The Pros of Using Infographics
There are multiple benefits when you use infographics in marketing and communications, including:
Easily Understandable
The purpose of making an infographic is that it is easy to understand quickly so the reader can focus on the information instead of trying to comprehend visual elements.
Shares Information in a Fun Way
Since infographics tend to be visually appealing, they are more likely to be shared virally than other heavily text-based communications.
Easily Shared Online
Since infographics are primarily visual, they can easily be posted on websites or shared via social media sites like Facebook and Twitter.
Gets Attention of New Readers
Cool infographics get people’s attention because they’re different than the standard text-heavy blog post. They typically don’t contain a ton of words, instead of focusing on a particular concept or topic with an eye-catching image to draw the reader in.
Delivers Complicated Information in an Effective Way
The key advantage of an infographic lies in breaking down tough information into simple ways with a combination of colors and multimedia icons to grab the interest of the reader.
Saves Reading Time
Instead of flipping through several pages of text to understand a concept, using infographics is going to enable more target audiences to use it over any other forms of information. With the inclusion of key points in the form of keywords and hints, the infographic is a must-use for readers.
Upgrades Authority of the Brand
Since infographics have recently created a buzz, any brand adopting this presentation format holds significant authority and stays updated with trends. It also gets a chance to reach large volumes of people with effective modes of communication. As a result, the major benefit lies in a better brand image.
The Cons of Using Infographics
While infographics can be an effective marketing tool, they also have their drawbacks which include:
Can Be Difficult to Create
Creating an infographic can be overwhelming and time-consuming; a lot of research is involved to ensure everything is correct. It takes just as much time to create an infographic as writing a blog post, and the thought of all that work might deter some people from creating one entirely.
It may Not Be Original
With so many infographics currently available, it isn’t easy to develop something truly original. For this reason, marketers may become tempted to use others’ creations to save time and energy spent on creating their own. This is a serious concern as it can affect the trustworthiness of infographics.
Visually Overwhelming
While infographics are visually appealing, they can also feel like information overload. If they contain too many words, it’s easy for the reader to become distracted and overwhelmed by all the visuals.
Time-Consuming Preparation
In addition to taking a lot of effort to create, infographics tend to take a long time for others to complete. Readers may lose interest before an infographic is finished being written, especially if it’s a long or complex topic. It is necessary to bridge the gap between readers and creators by utilizing appropriate tools and keeping information readily available.
Confusing for Readers
In addition to being visually overwhelming, infographics can be confusing when they contain too much information. This confusion may make readers more likely to scroll past the infographic without reading it.
9 Tips To Make the Best Infographics
While creating an infographic can seem intimidating, there are ways to make the process go more smoothly. Here are some of the exceptional tips on how to create a successful infographic!
1. Know Your Audience Before You Get Started
The initial step is to decide who you want your audience to be. Are they people within your organization? Consumers of your product? People in your community who don’t know much about the topic you’re covering in the infographic?
One better way to determine your audience’s wants is by looking at other infographics and doing content analysis. For example, if your infographic is for internal use, look at how others within your industry have created their graphics.
Notice the tone, the topics they choose to address, and how they are visually presented. These will all help you determine what your audience wants to see so you can tailor your infographic accordingly.
2. Choose a Topic That Your Audience Will Find Interesting
One mistake people make when creating infographics is choosing an unappealing topic that doesn’t capture their audience’s attention. Your topic needs to be interesting enough to keep your readers’ attention for the duration of the infographic.
It is an added benefit if you choose an interesting and informative topic. Some topics do better when they are trending and are overloaded with information but need a better way to present available information.
Applying interesting ways to present the topic to the audience can be a wonderful way to wear that winning hat.
3. Stick With One Idea Per Infographic
Sticking to one idea is a good way to ensure your graphic doesn’t seem overly complicated or confusing, especially if you use more than three colors or fonts. If you try to fill too much into one image, it’s difficult for the reader to understand and engage with what you’ve made.
Remember that sticking to one idea allows you to plan your infographic in the ideal size. Infographic makers tend to commit the mistake of creating long posters mainly to convey all information related to the subject.
On one hand, this approach can affect readability. On the other hand, it confuses the purpose of the infographic.
4. Make Your Infographic Accessible
One way to make your infographic more accessible is by adding words and phrases that help people who don’t know about the topic understand what they’re looking at.
A great example is in the infographic below, which explains all kinds of workouts with photos and easy-to-understand words.
5. Make It Fun!
One way to stand out with your infographic is by making it fun instead of boring or stiff. You want people to look forward to seeing your infographic and engaging with it. One way you can do this is by making the topic fun and interesting (see above) and including a humorous element to make people smile as they look at your graphic.
Another way to make your infographic fun is to play with colors and multimedia elements. Perhaps, infographic makers know the wide range of multimedia icons and elements open to them to present information. Exploring them can keep the reader glued and can deliver the essence.
6. Do Detailed Research
An infographic is all about effectively conveying critical and informative content. As you demonstrate usability with the infographic format, you may have to ask yourself several questions before you append information to the infographic.
- Does the audience need to know this?
- Is the source verified? Does it contain authentic information?
- Do I have the authority to share the finding from already conducted information?
- Is the research finding shared efficiently and comfortably so it creates the right impact on the audience?
When collecting data, you may have to ask these questions. Once you collate them to add to your infographic, you must demonstrate the intensity of the background research you have carried out.
Say no to misinformation. Focus adequate time on research and present a balanced finding.
7. Make it easy to eyes
Just because you can append too much information doesn’t mean you can make the work look clumsy. The problem with most infographic makers is that too much information gets clustered and can strain readers’ eyes.
When there is insufficient white space, readers get to deviate from the infographic’s purpose. In other words, the infographic loses its value when you do not know how to organize it from a visual perspective.
- Allow enough space between visual elements.
- Prepare multiple layouts to choose the best.
- Choose the right color scheme and align the content accordingly.
- Self-assess the infographic for its readability score.
8. Mention sources
The common mistake committed by several infographic makers is the lack of addition of references/sources that were used to create the output. Sources are as important as contact details.
When you add authoritative information to your infographic, you must be mindful of its authenticity and credibility so it convinces the audience. Leave the footer space for adding sources.
Remember not to add outdated sources, as they add no value and can potentially bring down the quality of your graphic.
9. Use the Best Tool Like Venngage
The most discussed issue when making infographics is that it may be challenging to create one. The most exciting news, we have a solution for that!
Venngage is an online infographic maker that provides a wide range of templates for everyone. Here are some of the best infographics from their website to offer you a better idea!


Bonus tip – Let your strategy speak!
If you look at the infographics presented above, you can notice that they are neatly aligned with a strategic choice of colors, text, and size.
Based on the topic of discussion, remember to incorporate your strategy. This can multiply your outcome and also attract your audience quicker than ever.
You may check our article; we have included an infographic image that helps us bring many visitors.
Checklist for a good infographic
Whether you are a beginner or an expert in preparing infographics, it is a good idea to use a checklist that gives a quick understanding of whether your infographic is good or not.
- Does it revolve around ONLY ONE TOPIC?
- Are findings supported with sources at the end?
- Is the infographic informative, relevant, and interesting?
- Is the infographic language understandable to the target audience?
- Does it follow an appropriate color scheme and layout to match your strategy?
- Are grammatical, alignment, spelling, and formatting errors fixed?
- Is it clutter-free?
- Have you shared with others and collected their reviews?
- Have you established key variables that must be tested and measured after using the infographic?
- Is there a way to allow readers to share on other platforms?
These factors are extremely simpler to monitor in your infographic, and you can also proliferate results with this checklist. Irrespective of the domain you work on and the content you share, this checklist will still give you the answer declaring the success or failure of the infographic.
Create better infographics – Wrapping Up
Infographics are a great way to break down information into something easy for the reader to understand. It improves user engagement. However, there will be some pitfalls you should avoid when creating them in order not to lose your audience’s attention.
To avoid these, follow the tips above, and don’t forget to use Venngage infographics. Start your journey toward marketing success by making your very own infographic today! Also, share your viewpoint in the comment section!
Hi Nirmala,
It was an amazing resource! I recently started adding infographics to my website, and I will be using your tips to create better and more high-quality infographics in the future. All of your tips are very helpful, and I am looking forward to implementing them into my process. Thanks for sharing the process and tips, it will be a great help. I will also share this article within my network to help other bloggers and marketers as well. Looking forward to reading more of your amazing articles.
Hey Nirmala,
A great infographic can convey a story, new or previously undiscovered information, or can present a new angle or fresh perspective on accepted wisdom. It should be compelling, in terms of the information and the visual design. It should tell a meaningful story in an instant and should be easy to skim read.
thank you sharing this great infographic article.